Introduction
Performance optimization in Unity3D is a crucial aspect of game development. Profiler.BeginSample is one of the powerful tools that allows developers to closely monitor and analyze script performance. This enables a better understanding of which elements of the game may require optimization, leading to improved performance and smoother gameplay.
What is Profiler.BeginSample?
Profiler.BeginSample is a method in Unity3D that allows tracking and recording the execution time of specific code segments. This enables developers to see how long it takes to execute a given function or script, helping to identify performance bottlenecks. Using this function is particularly useful in larger projects where even minor delays can affect the overall gaming experience.
Why is Profiler.BeginSample Important?
In large Unity3D projects where multiple systems are running simultaneously, it’s easy to overlook inefficient code fragments that can slow down the game. Using Profiler.BeginSample allows for detailed analysis, enabling effective identification and optimization of these areas. Reducing the execution time of key functions translates to better game performance, higher FPS, and a more responsive gameplay experience.
How to Use Profiler.BeginSample for Optimization
To use Profiler.BeginSample in Unity3D, follow these steps:
- Add BeginSample
Identify the specific code segment you want to profile. This could be a function or a loop where you suspect performance issues may arise. At the beginning of this segment, insert the following line of code:Profiler.BeginSample("SampleName")
Here, replace"SampleName"with a descriptive label that reflects the purpose of the code being profiled. This name will help you recognize the sample later in the Profiler window. - Add EndSample
Once the execution of the code segment is complete, you need to mark the end of the profiling session. Immediately after the code you wish to profile, add the line:Profiler.EndSample();
This will conclude the timing for the specific segment, allowing the Profiler to log the duration and performance metrics associated with that code execution. - Analyze the Results
With the profiling segments added, run your game and open the Unity Profiler. You will be able to see the performance data collected for each labeled sample. By examining the results, you can identify which segments of your code are consuming the most time and pinpoint any potential bottlenecks that may require further optimization.
Example of Using Profiler.BeginSample:
Code Before Using Profiler.BeginSample
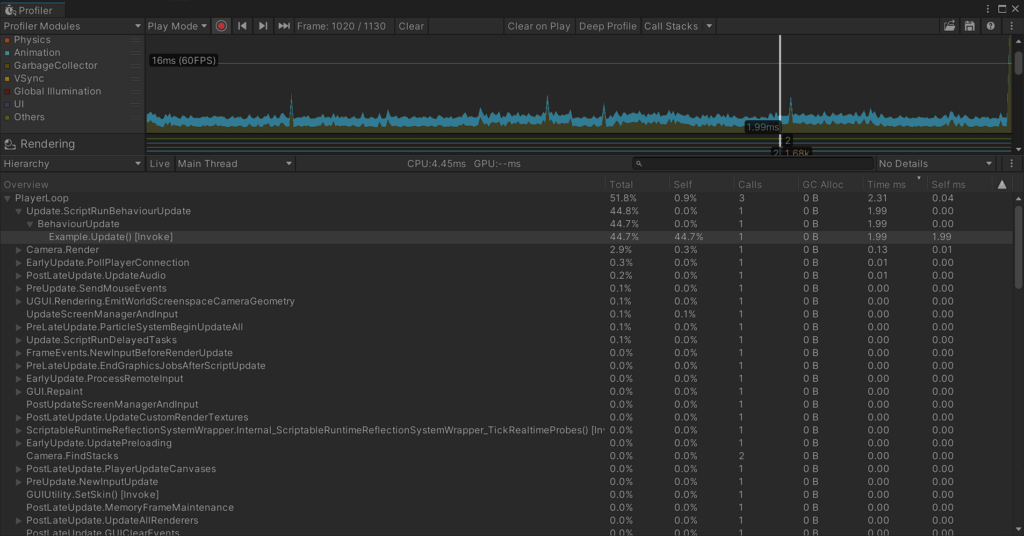
Before adding Profiler.BeginSample, the Profiler provides general performance data, but we cannot precisely examine individual code segments. In this example, we have a function that processes a heavy operation in the game. Here’s the code snippet before implementing Profiler.BeginSample:
using UnityEngine;

public class Example : MonoBehaviour
{
    private void Update()
    {
        PerformHeavyOperation();
    }

    private void PerformHeavyOperation()
    {
        for (int i = 0; i < 1000000; i++) { }
    }
}
Profiling Results Before Adding BeginSample:
The following image shows the profiling results from the Profiler before applying Profiler.BeginSample. As seen, we get an overview of the performance metrics, but it lacks the granularity needed to identify specific bottlenecks.

Code After Using Profiler.BeginSample
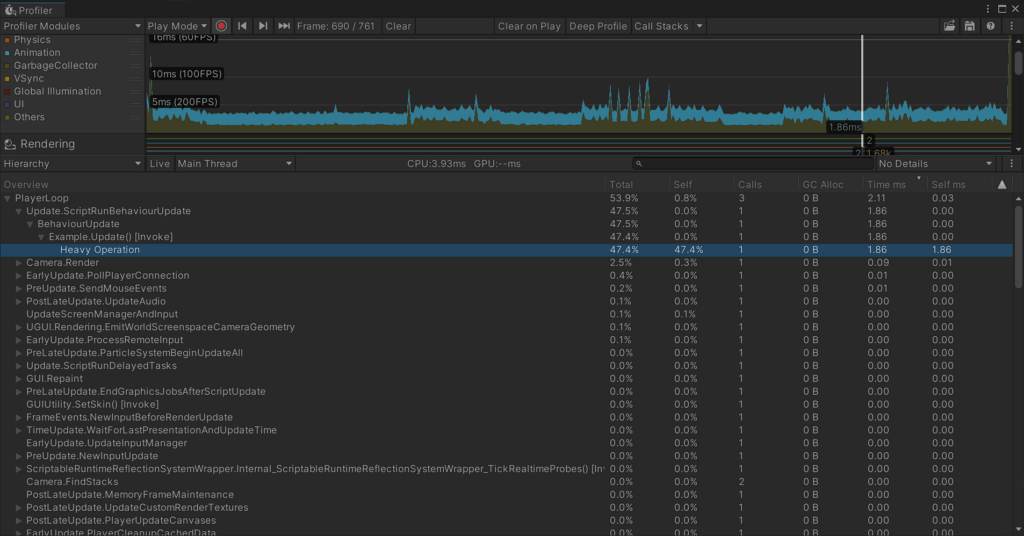
After adding Profiler.BeginSample in key areas of the code, we can more accurately monitor the execution time of specific functions. This allows for more detailed data regarding the performance of individual script segments. Here’s the updated code:
using UnityEngine;
using UnityEngine.Profiling;

public class Example : MonoBehaviour
{
    private void Update()
    {
        Profiler.BeginSample("Heavy Operation");
        PerformHeavyOperation();
        Profiler.EndSample();
    }

    private void PerformHeavyOperation()
    {
        for (int i = 0; i < 1000000; i++) { }
    }
}
Profiling Results After Using BeginSample:
With Profiler.BeginSample implemented, we can now get a clearer view of how long it takes to process the enemies. Below is the updated profiling result from the Profiler after applying BeginSample, which shows the execution time for the “Process Enemies” segment specifically.

Conclusion
Using Profiler.BeginSample provides valuable insights into the execution time of specific code segments. By comparing the profiling results before and after implementing this method, developers can better understand where performance bottlenecks may occur and take appropriate action to optimize their code effectively.
[…] for more insights on optimizing code performance, check out our previous blog post on Profiler.BeginSample, which details how to use this method to analyze code execution time and […]